IC Markets Home Sign in Web Trader Contáctanos
IC Markets Social IC Markets Social

Información para
Operadores Serios

  • Acerca de IC Markets
  • ABRA UNA CUENTA BURSÁTIL
  • PRUEBE UNA DEMO GRATIS
  • Comienza a Operar
  • VISIT OUR BLOG
IC Markets Social
  • Acerca de IC Markets
  • ABRA UNA CUENTA BURSÁTIL
  • PRUEBE UNA DEMO GRATIS
  • Comienza a Operar
  • VISIT OUR BLOG
July 25, 2024Australian_Stocks_enIC Markets

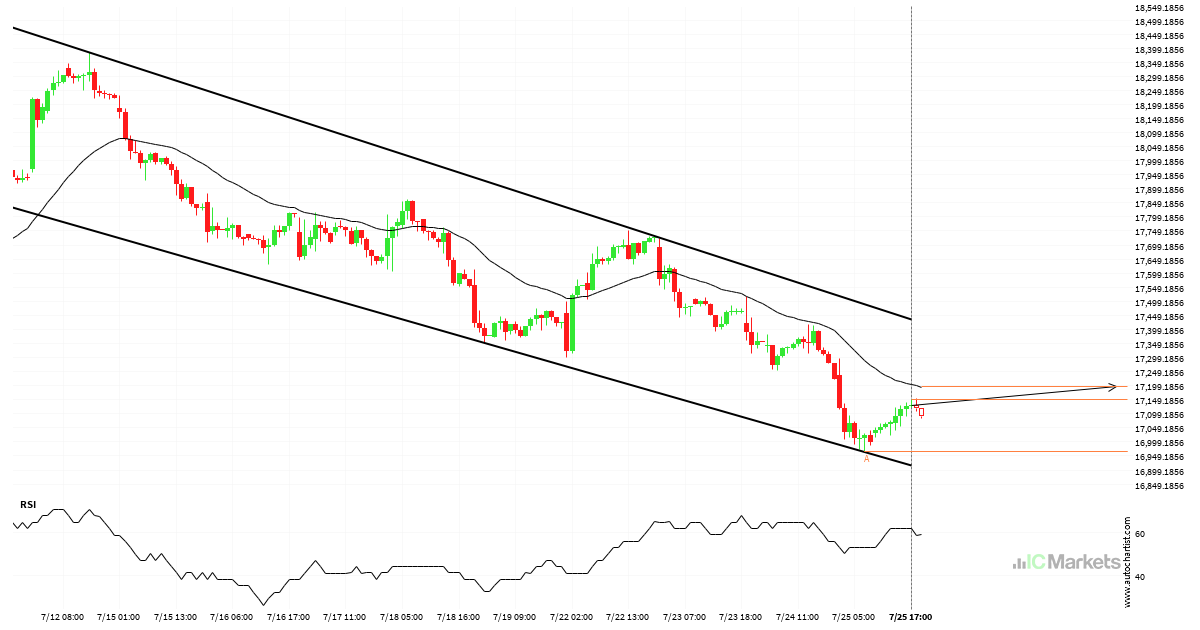
Will Hong Kong 50 Index have enough momentum to break resistance?

Hong Kong 50 Index is heading towards the resistance line of a Channel Down. If this movement continues, the price of Hong Kong 50 Index could test 17195.6192 within the next 3 days. It has tested this line numerous times in the past, so this movement could be short-lived and end up rebounding just like […]

Read more
July 24, 2024Australian_Stocks_enIC Markets

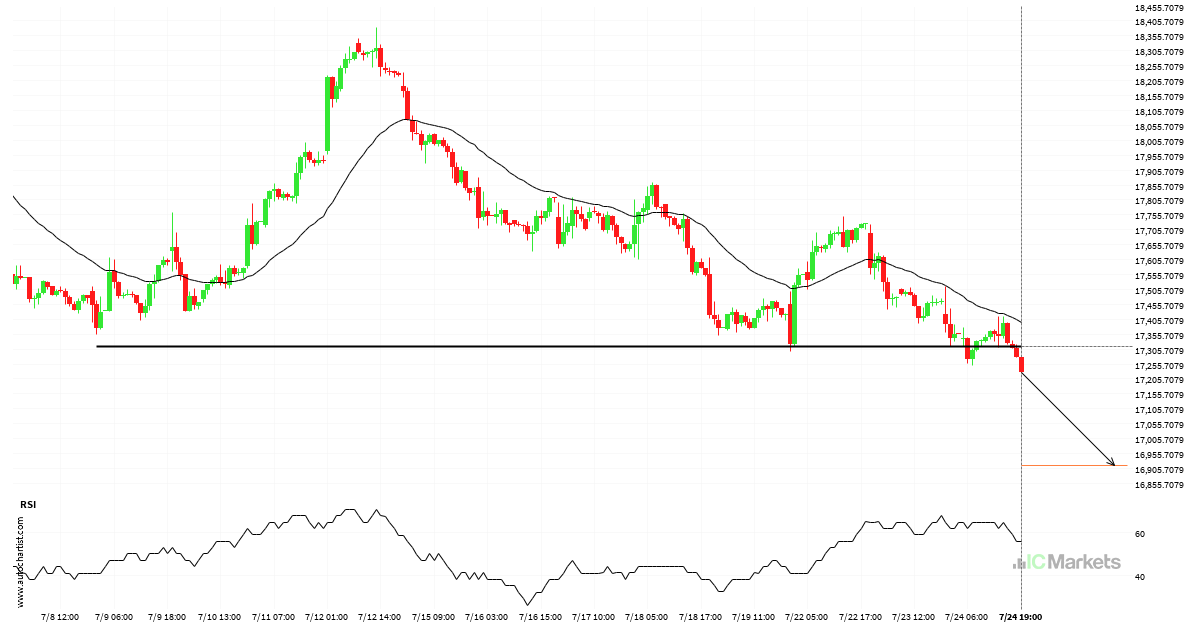
Big movement possible on Hong Kong 50 Index

Hong Kong 50 Index has broken through a support line. It has touched this line numerous times in the last 16 days. This breakout shows a potential move to 16916.8711 within the next 3 days. Because we have seen it retrace from this level in the past, one should wait for confirmation of the breakout.

Read more
July 23, 2024Australian_Stocks_enIC Markets

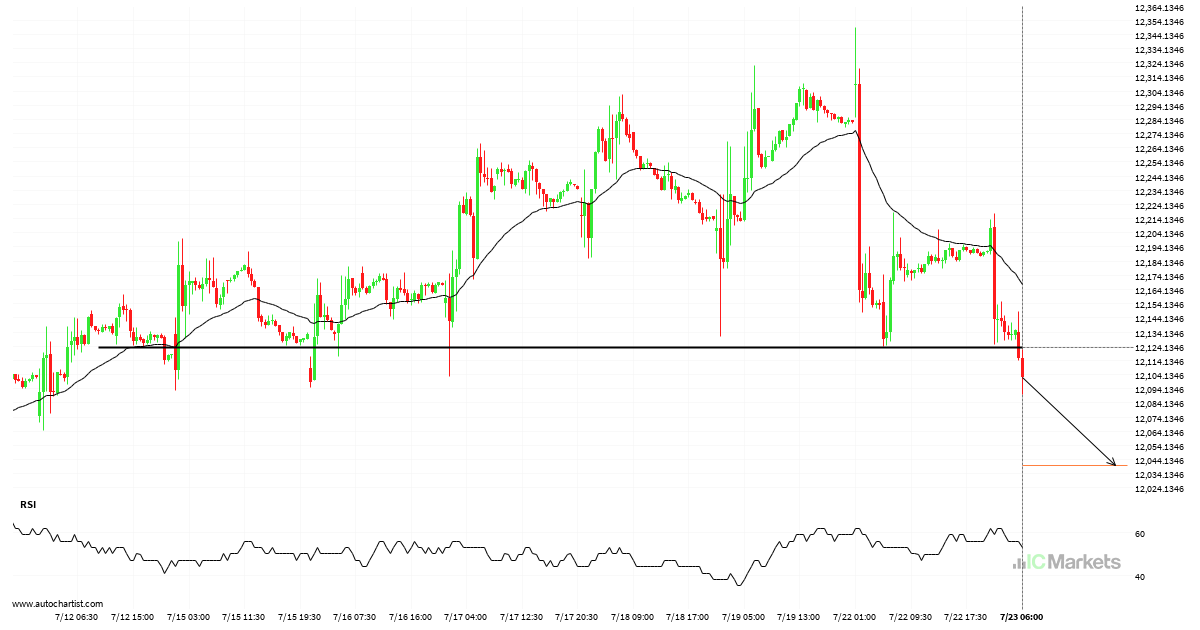
FTSE China A50 Index broke through important 12123.0498 price line

The breakout of FTSE China A50 Index through the 12123.0498 price line is a breach of an important psychological price that is has tested numerous in the past. If this breakout persists, FTSE China A50 Index could test 12040.2188 within the next 2 days. One should always be cautious before placing a trade, wait for […]

Read more
July 22, 2024Australian_Stocks_enIC Markets

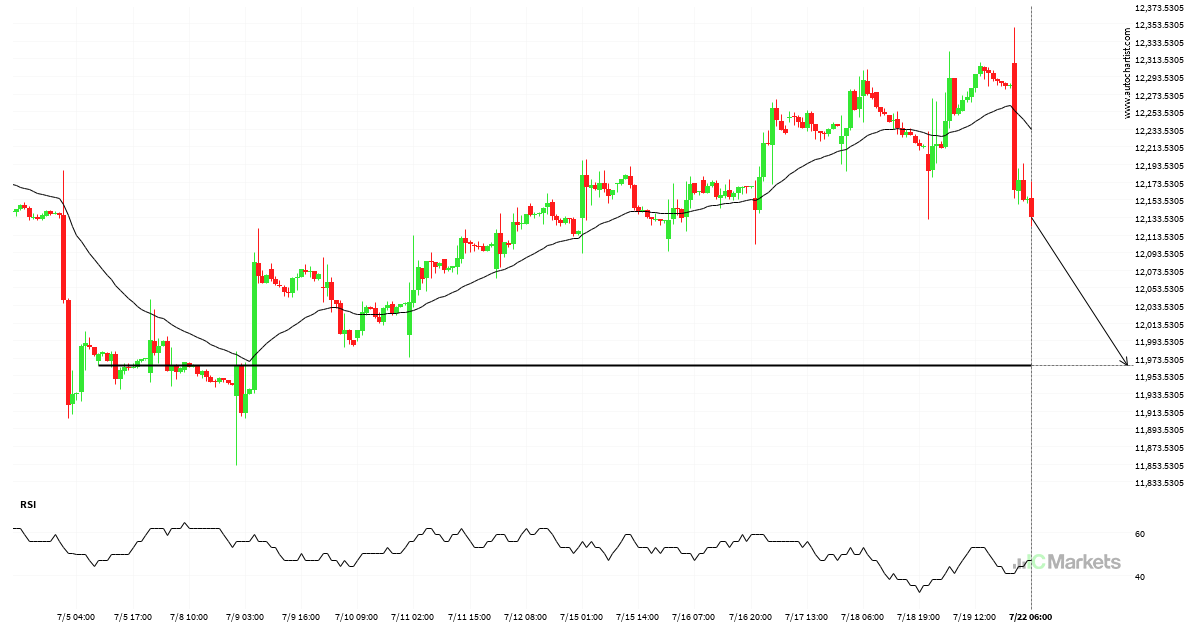
Breach of important price line imminent by FTSE China A50 Index

The movement of FTSE China A50 Index towards 11965.6797 price line is yet another test of the line it reached numerous times in the past. We could expect this test to happen in the next 3 days, but it is uncertain whether it will result in a breakout through this line, or simply rebound back […]

Read more
July 21, 2024Australian_Stocks_enIC Markets

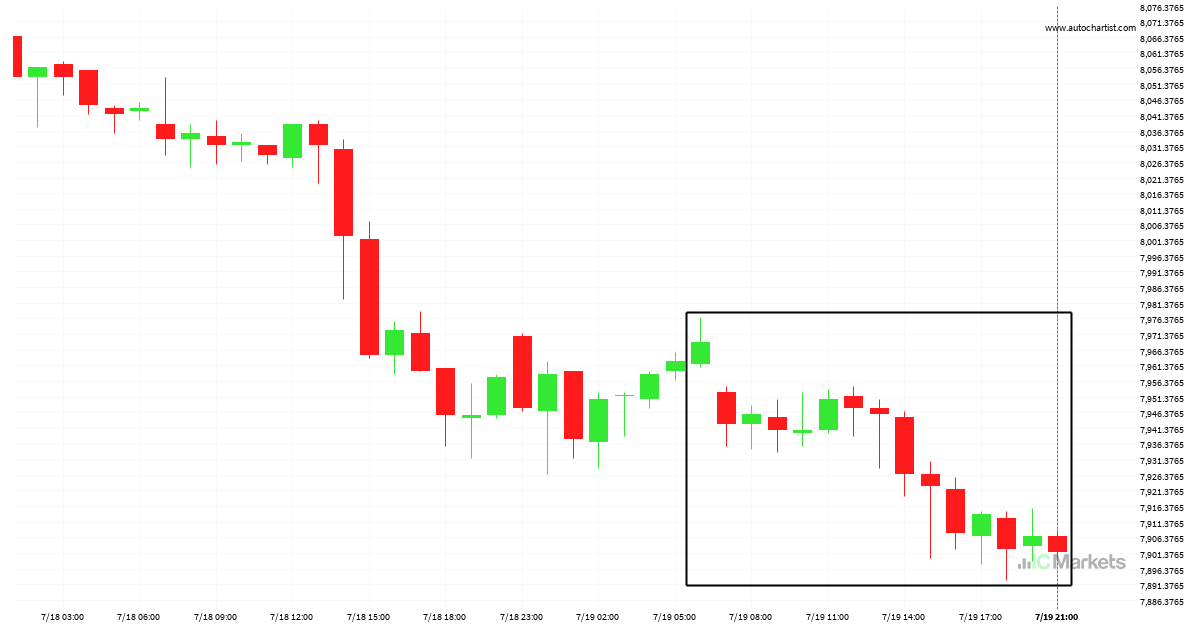
Australia 200 Index experienced an exceptionally large movement

Australia 200 Index has experienced an exceptionally large movement lower by 0.84% from 7968.7 to 7901.7 in the last 15 hours.

Read more
July 17, 2024Australian_Stocks_enIC Markets

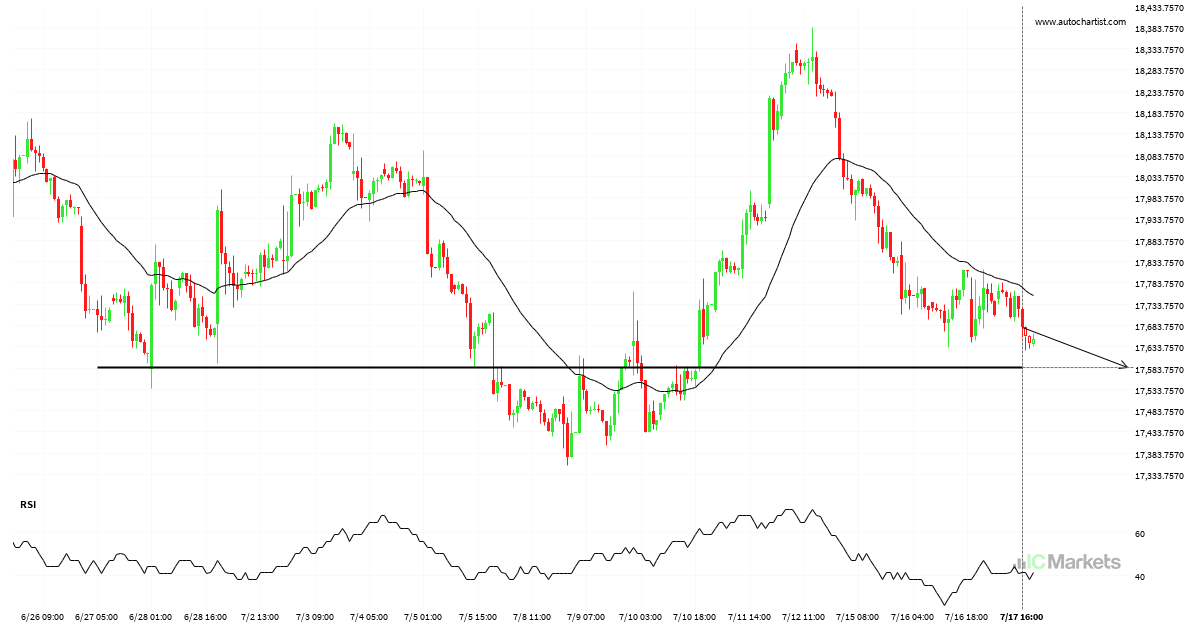
Breach of important price line imminent by Hong Kong 50 Index

The movement of Hong Kong 50 Index towards 17584.2891 price line is yet another test of the line it reached numerous times in the past. We could expect this test to happen in the next 3 days, but it is uncertain whether it will result in a breakout through this line, or simply rebound back […]

Read more
July 17, 2024Australian_Stocks_enIC Markets

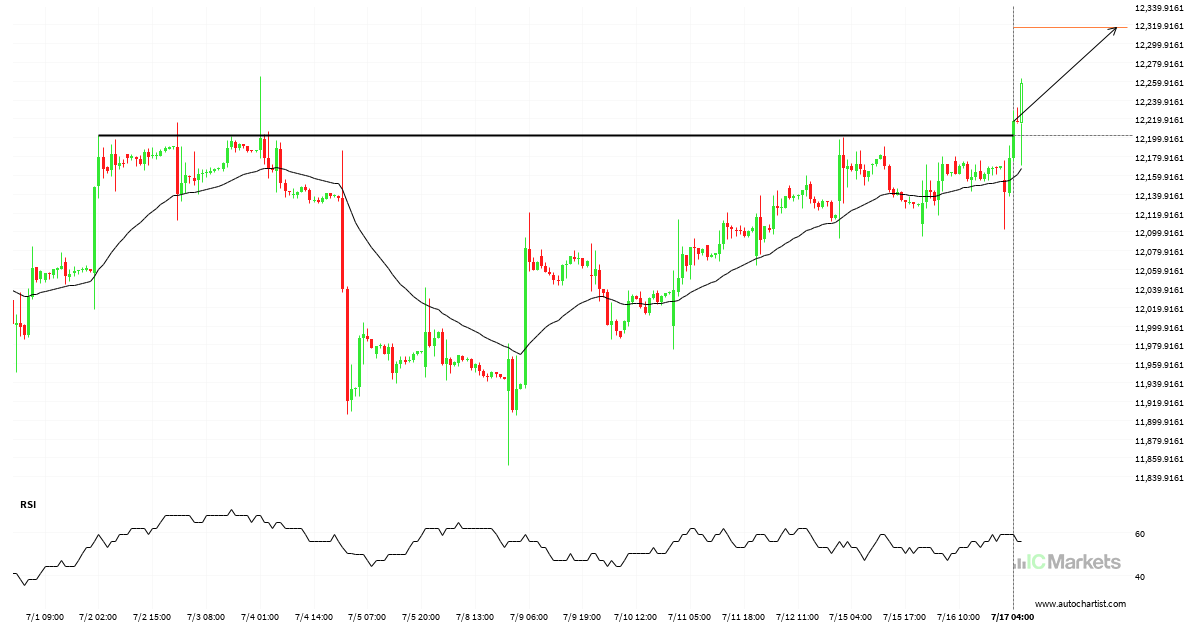
Resistance breakout on FTSE China A50 Index

FTSE China A50 Index is once again retesting a key horizontal resistance level at 12202.7305. It has tested this level 7 times in the recent past and could simply bounce off like it did last time. However, after this many tries, maybe it’s ready to start a new trend.

Read more
July 15, 2024Australian_Stocks_enIC Markets

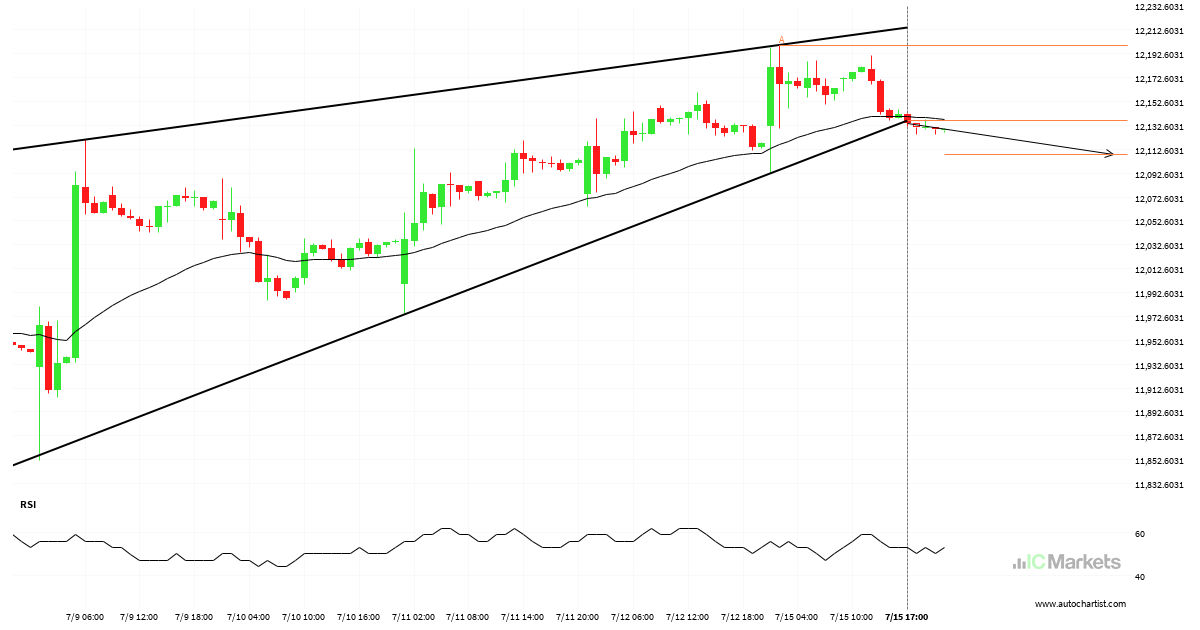
FTSE China A50 Index trade outlook at 2024-07-15T18:00:00.000Z until 2024-07-15T18:00:00.000Z

The last 7 1 hour candles on FTSE China A50 Index formed a Rising Wedge pattern and broken out through the pattern lines, indicating a possible bearish movement towards the price level of 12108.2736.

Read more
July 12, 2024Australian_Stocks_enIC Markets

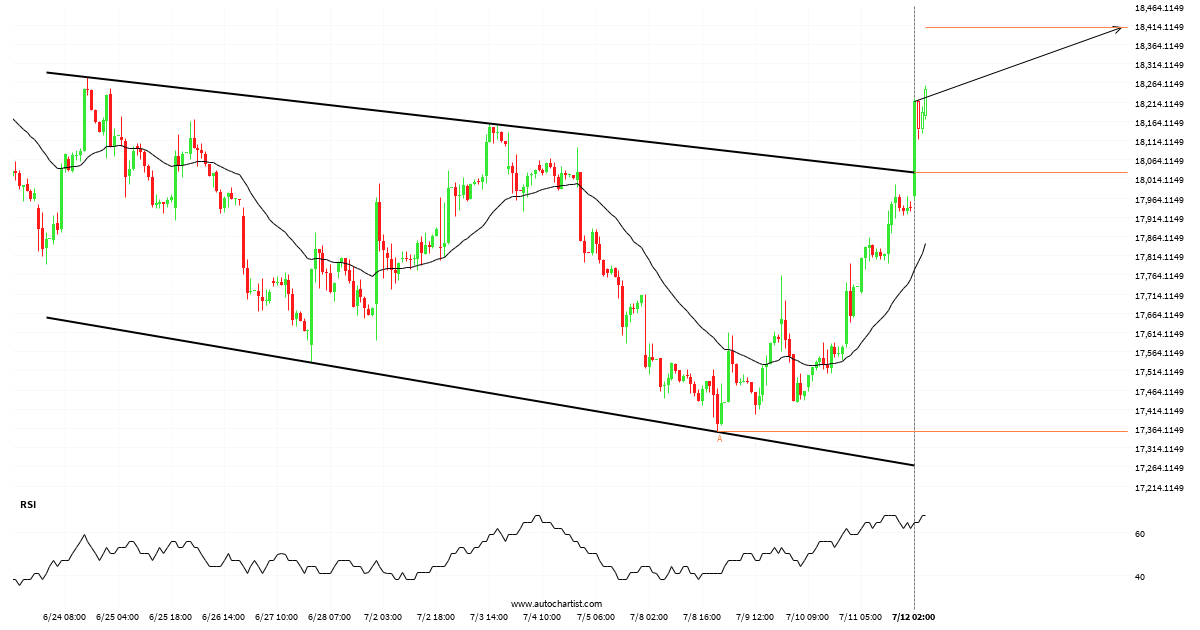
Hong Kong 50 Index trade outlook at 2024-07-12T03:00:00.000Z until 2024-07-12T03:00:00.000Z

The last 18 1 hour candles on Hong Kong 50 Index formed a Channel Down pattern and broken out through the pattern lines, indicating a possible bullish movement towards the price level of 18407.1934.

Read more
July 11, 2024Australian_Stocks_enIC Markets

Continuation pattern on Hong Kong 50 Index

Triangle pattern identified on Hong Kong 50 Index has broken through a resistance level with the price momentum continuing to move in an upward direction. A solid trading opportunity continues with the price expected to reach 17817.1177 in the next 19.

Read more
  • 1
  • 2
  • 3
  • …
  • 6
  • 7
  • 8
  • 9
  • 10
  • 11
  • 12
  • …
  • 153
  • 154
  • 155

Recent Posts

  • US Dollar vs Swiss Franc – ChartPattern – قناة صاعدة
  • Gold vs US Dollar- KeyLevel – แนวรับ
  • Gold vs Euroymbol – KeyLevel – แนวรับ
  • Gold vs Euro – KeyLevel – مقاومة
  • Gold vs Euro – KeyLevel – مقاومة

Recent Comments

    Traducción


     Edit Translation

    Opere con un

    líder del mercado en el que puede confiar

    ABRA UNA CUENTA BURSÁTIL PRUEBE UNA DEMO GRATIS

    Trading en Forex

    • Qué es Raw Spread
    • Resumen de cuentas
    • Abre una Cuenta
    • Trader Launch en Web

    Especificaciones de Trading

    • Spreads y Comisiones
    • Rango de Mercados
    • Horas de Trading
    • Depósitos
    • Retiros

    Acerca de IC Markets

    • Help Center
    • Por qué con IC Markets
    • Regulación
    • Documentos Legales
    • Contáctanos


    Forex Trading

    • Accounts Overview
    • Open an Account
    • Launch Web Trader

    Trading Specifications

    • Spreads and Commissions
    • Range of Market
    • Trading Hours
    • Funding
    • Withdrawal

    About IC Markets

    • Chat with a Specialist 24/7
    • Why IC Markets
    • Regulation
    • Legal Documents
    • Contáctanos

    Descargo de responsabilidad: Estos documentos son material de marketing cuyo contenido es publicado solo con propósitos informativos. Este material no contiene y no debe ser considerado un consejo de inversión y recomendaciones, o sugerencias para llevar a cabo otras acciones con los instrumentos financieros. Los widgets integrados pertenecen a sus autores independientes externo, y IC Markets no es responsable de su contenido o cómo afectan en las operaciones.

    Derechos reservados de todo el contenido. Las opiniones de los autores tal vez no coincidan con la opinión de los editores del blog. Cuando copie material de este sitio o conecte RSS para volver a publicar nuestros artículos, es obligatorio el enlace a IC Markets o la atribución en el formato “Blog de IC Market”. Para dudas generales, por favor, póngase en contacto con la oficina editorial a través de la página “Contacto”.

    Advertencia de riesgo: Operar derivados conlleva un altor riesgo en su capital y solo debería operar con capital que puede permitirse perder. Las operaciones con derivados podrían no ser adecuadas para todos los inversores, por lo tanto, asegúrese de entender por completo los riesgos que conlleva y buscar asesoramiento independiente si fuera necesario. Una Declaración de Divulgación del Producto (PDS, por sus siglas en inglés) se tendrá en cuenta antes de participar en una transacción con nosotros.

    Los contenidos de esta página son solo información general y no tienen en cuenta su situación personal, objetivos financieros o necesidades. Depende de usted garantizar que los productos que ofrecemos se ajustas a sus necesidades específicas. No debería operar con nosotros a menos que entienda las características y riesgos de los productos que ofrecemos. Esto significa que tal vez necesite buscar asesoramiento independiente antes de empezar a operar con nosotros.

    © 2022 Raw Trading Ltd | All rights reserved.
    • Sample Page